

Visualised for insight
Chart types
From quick bar comparisons to priority matrices and word clouds – every chart type is designed to highlight key insights with minimal effort.
Basic charts
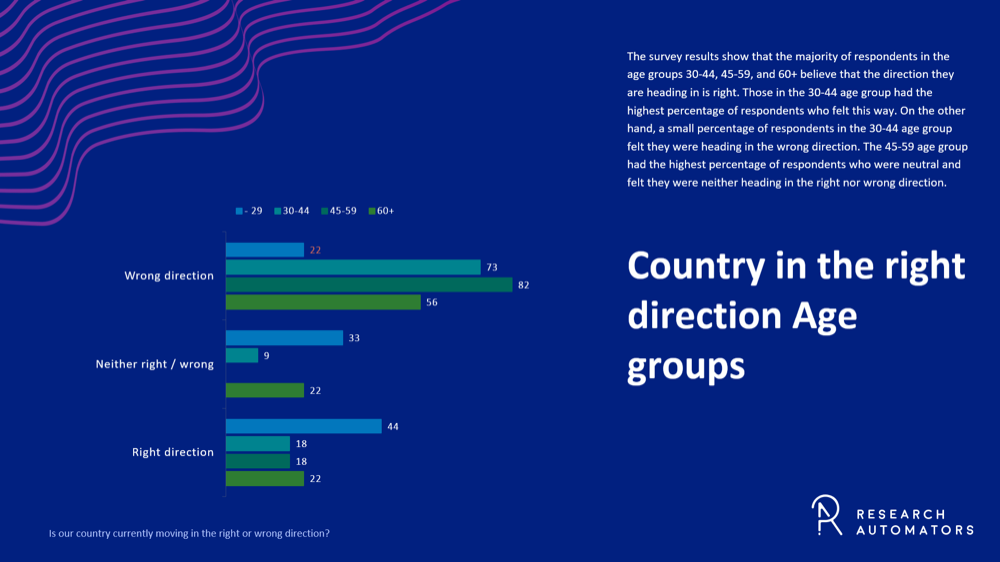
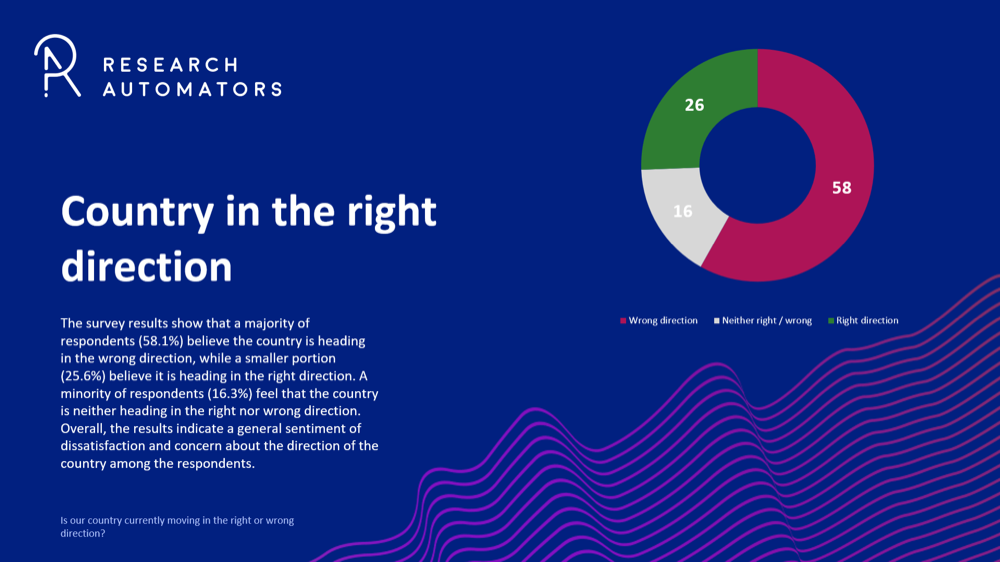
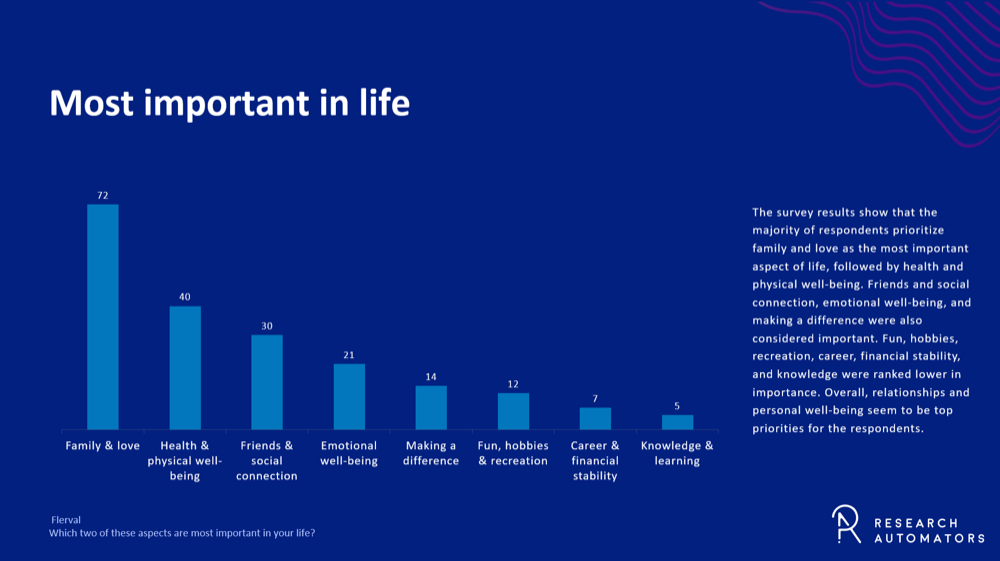
Simple and effective formats for distributions and scores. Use grouped or stacked layouts to compare categories or show proportions within each group – ideal for most standard survey questions.
Scale & rating charts
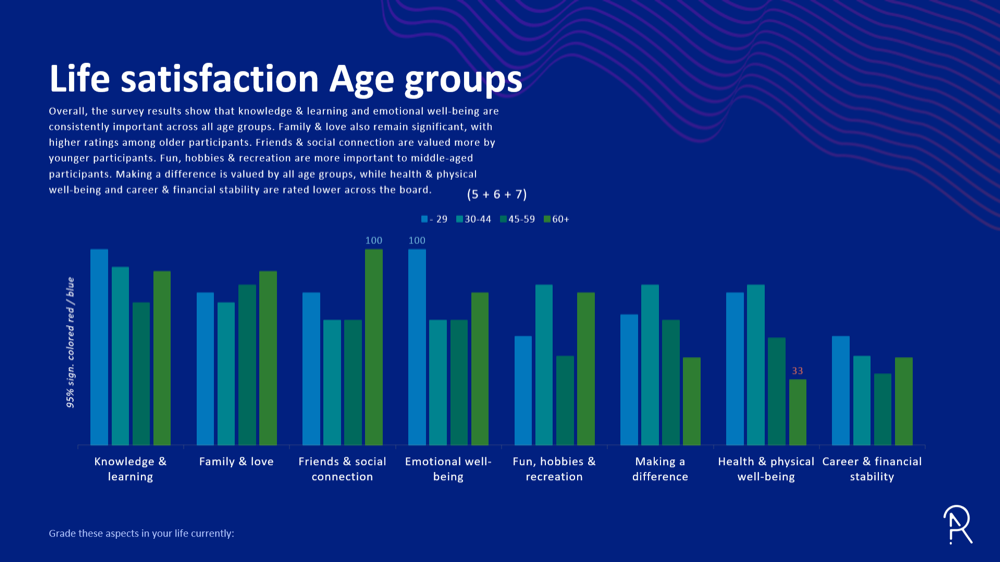
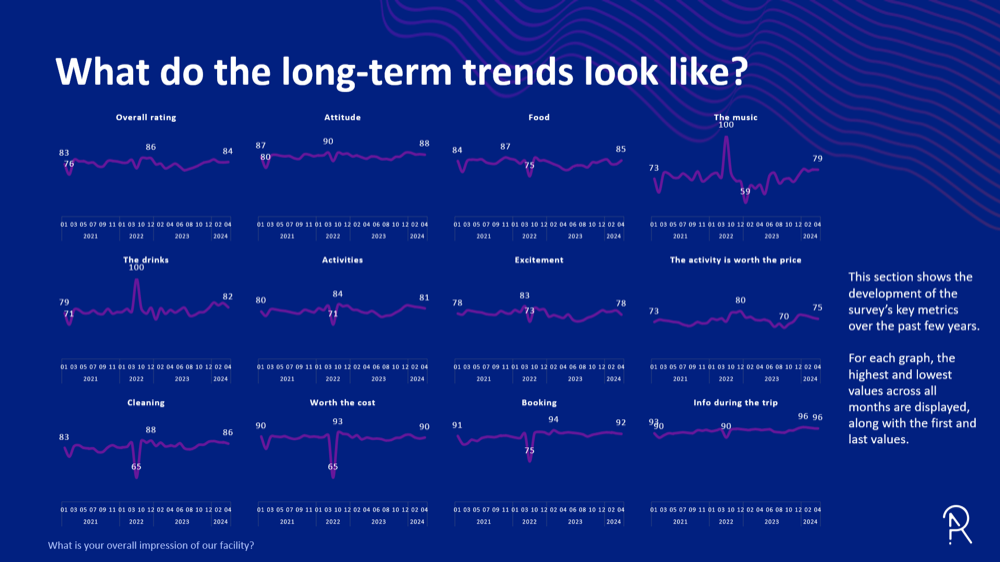
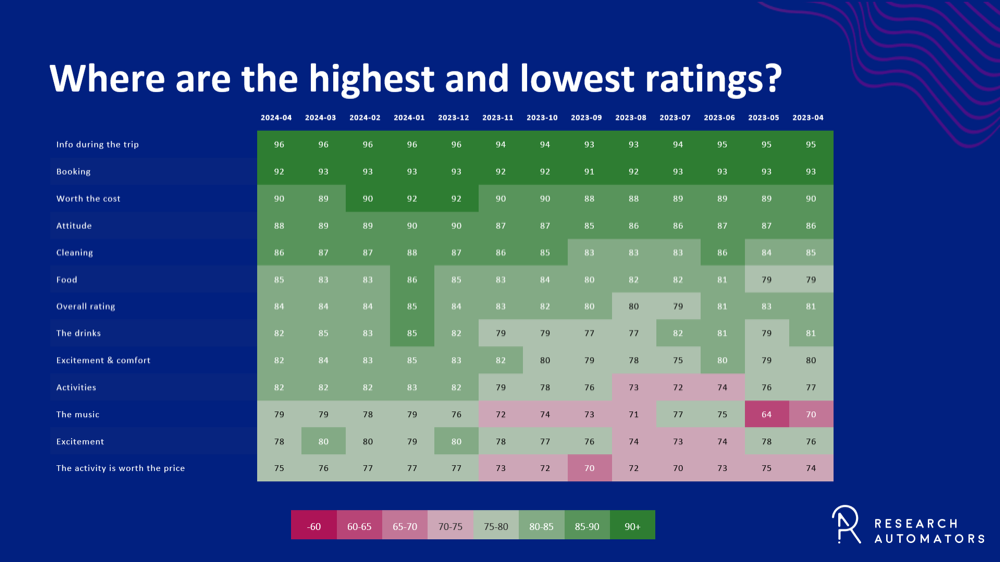
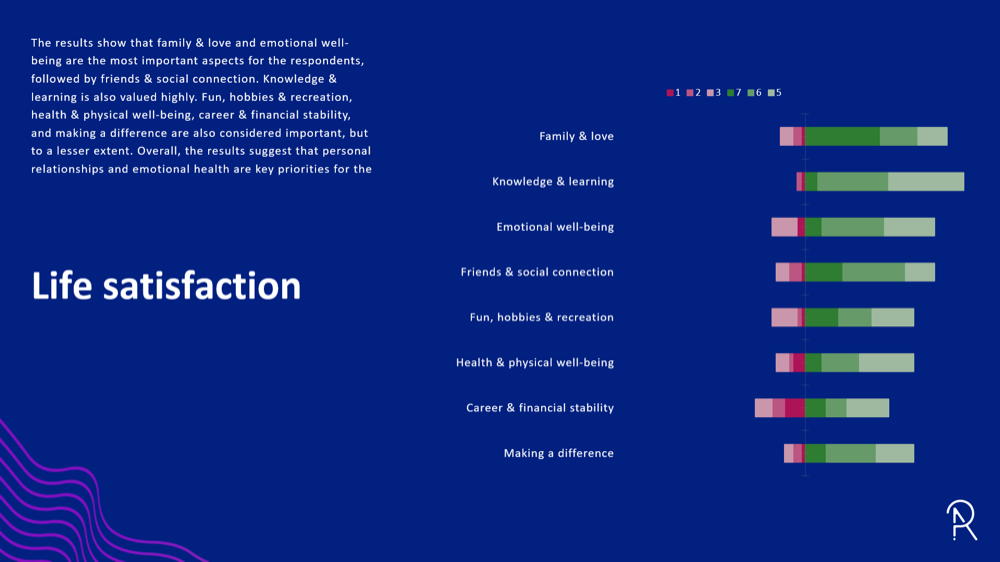
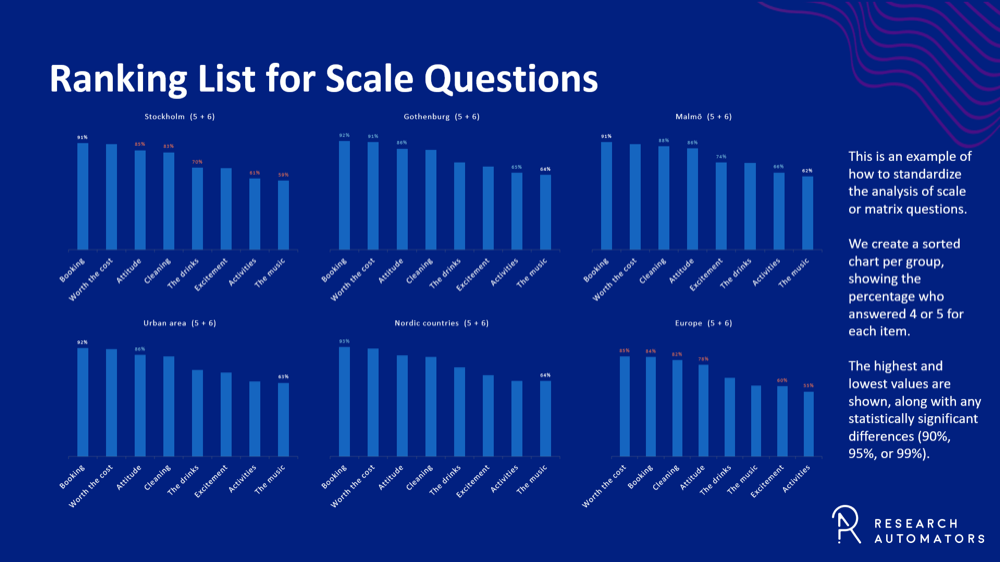
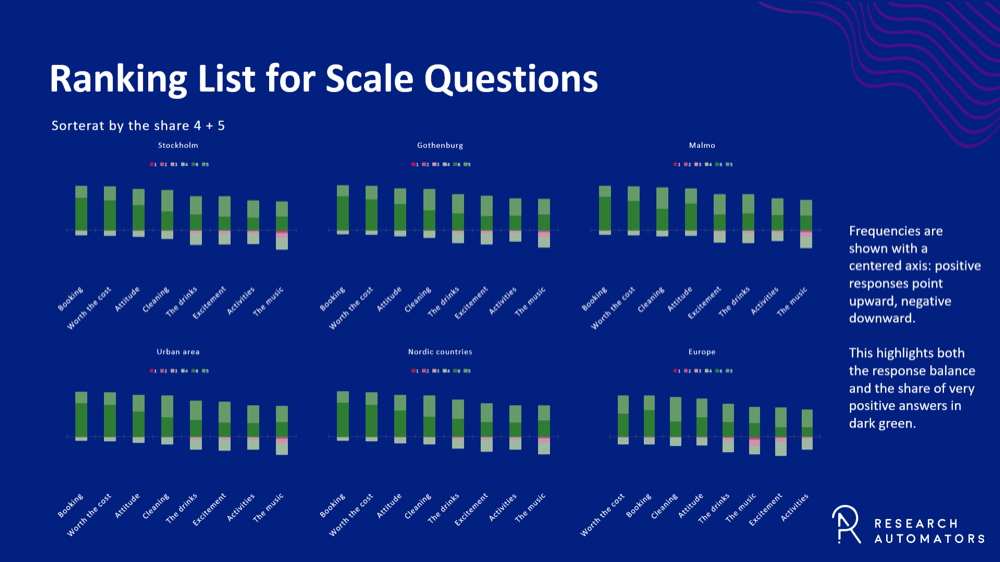
Summarise agreement levels, satisfaction scores and other scaled responses. Average bars, heatmaps and stacked scales highlight patterns and intensity across items or over time.
Comparative charts
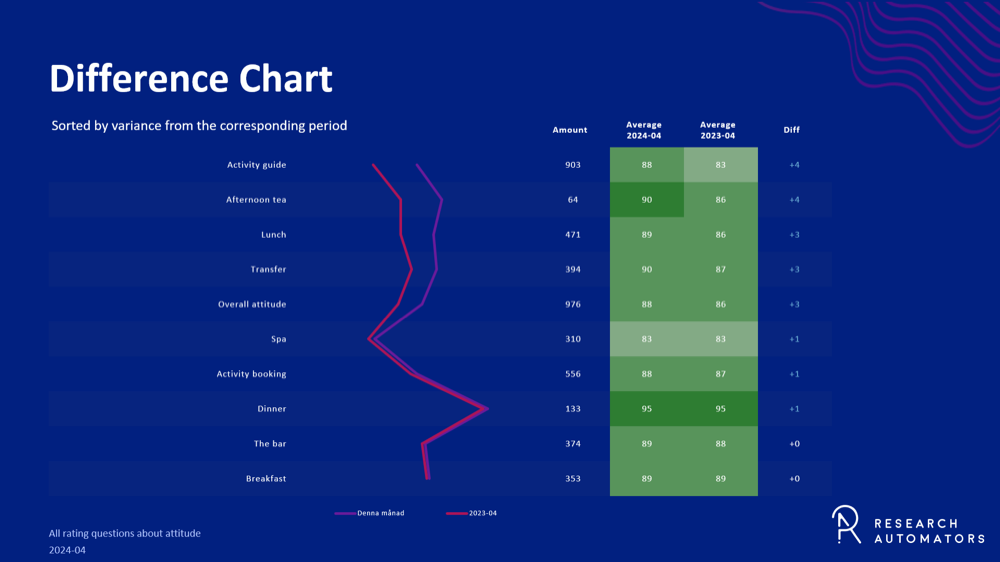
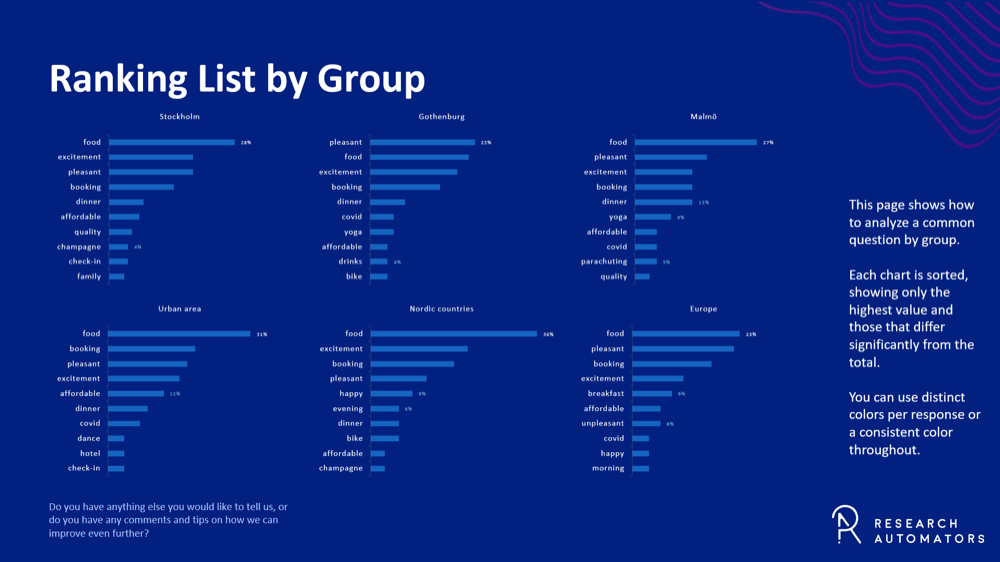
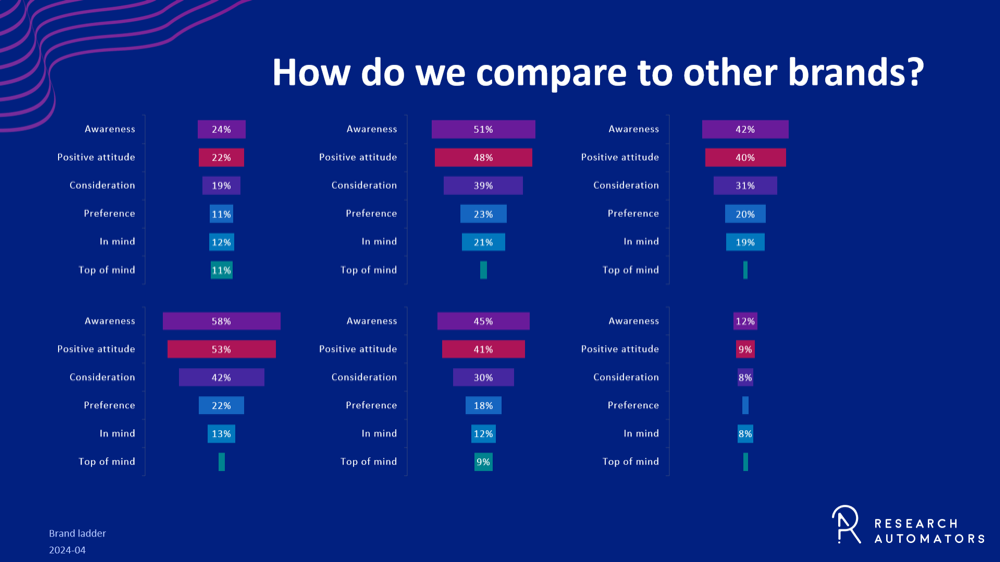
Compare results across key segments. Side-by-side layouts and difference charts help you spot gaps, trends and outliers between groups or survey waves.
Insight & impact charts
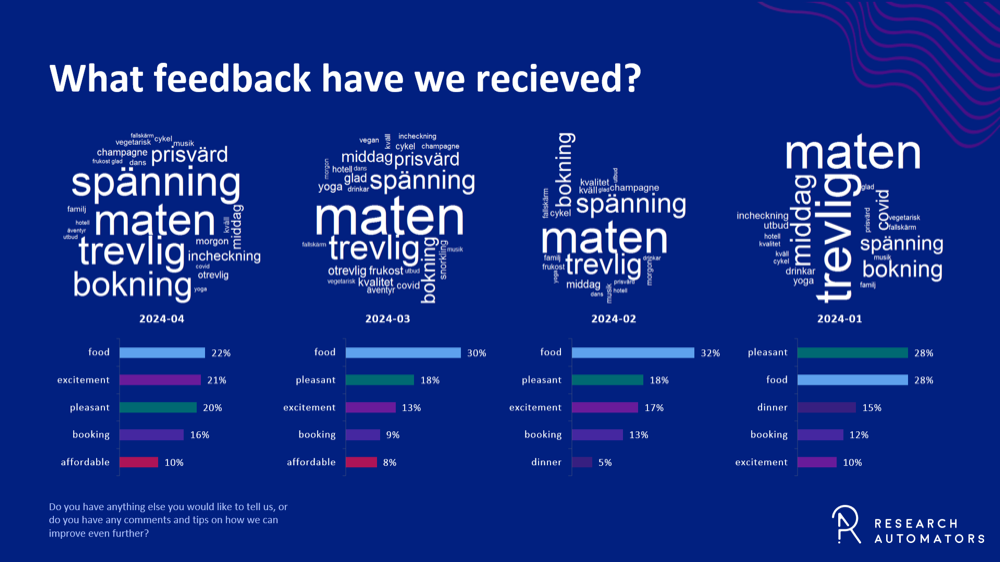
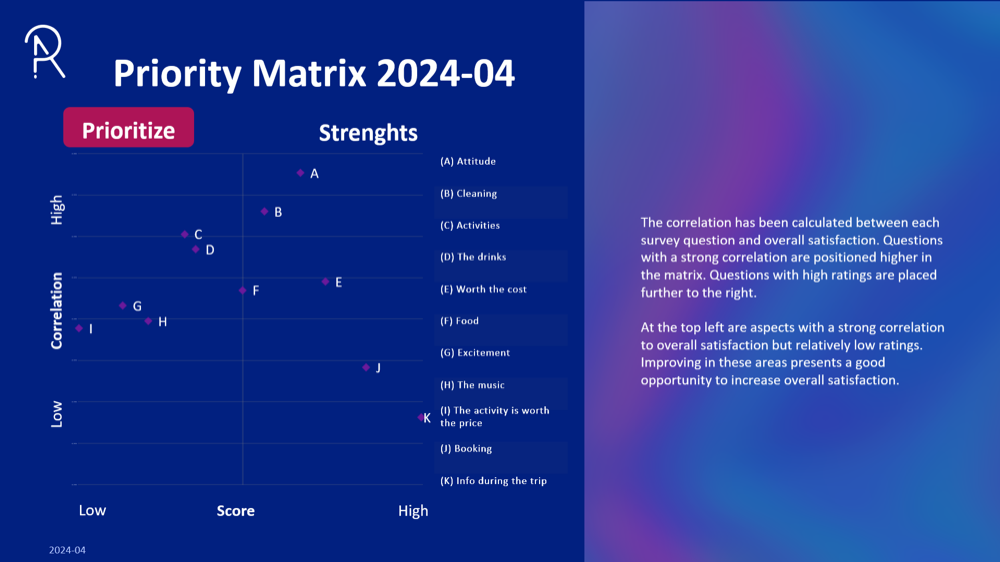
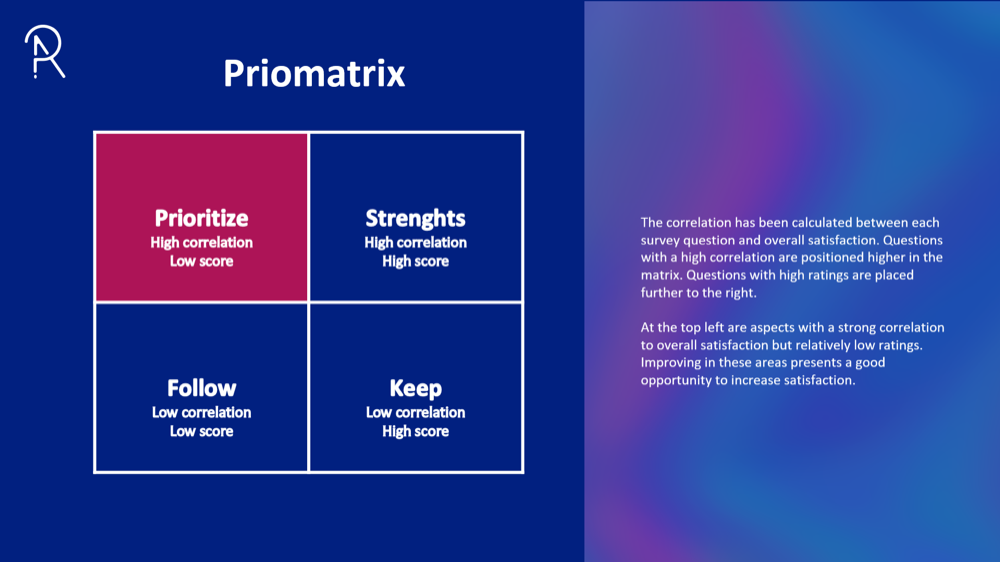
Surface what matters most. These charts combine satisfaction, frequency and correlation to highlight key drivers, strategic gaps and patterns in open-ended feedback.
Not sure where to start?
Let us start with a small research project that we set up and manage for you at a fixed price. We'll show you what's possible in the platform – without you having to commit.